Diagnostics
OnVeris includes two diagnostic tools for troubleshooting: the Node Log, which shows live output from each connected Node, and System Tracing, a structured real-time trace viewer for the Gateway's internals. You can use them together to find out why a Node, a model or a request is not behaving as expected.
The Gateway, the Node and the installer also write log files on their own machines. These are useful when a service will not start, so the Gateway cannot show anything. See Log Files.
Node Log
The Node log is the first place to look when a Node or a model is misbehaving. On the Nodes page, click the edit icon on a Node, then find the Log panel.
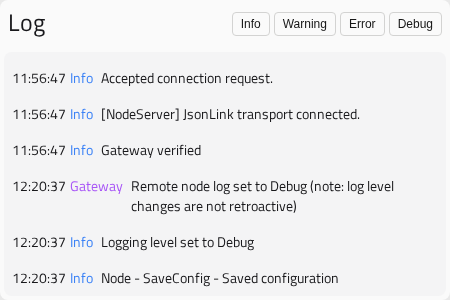
Log entries are colour-coded by level:
| Level | Colour | Meaning |
|---|---|---|
| Info | Blue | Normal operational messages |
| Debug | Green | Detailed messages useful for tracing behaviour |
| Warning | Yellow | Something unexpected, but not a failure |
| Error | Red | A failure occurred |
| Critical | Red (bold) | A serious failure that may affect operation |
| Gateway | Purple | Messages from the Gateway side of the connection |
The Info, Warning, Error and Debug buttons set how much detail the Node logs. The change applies from then on, not to entries already shown. Click Show earlier entries to see older lines.
System Tracing
System Tracing records structured traces of the Gateway's work, grouped by area. It is useful for problems that do not show in the Node log — for example, sign-in failures, API requests being refused, or problems in the inference pipeline.
Turning On System Tracing
System tracing is off by default. To turn it on:
- Open Settings → General.
- Turn on Advanced Developer Features.
- Turn on Enable System Tracing.

Note
Tracing only captures events after it is turned on. It turns itself off when the Gateway restarts. Avoid leaving it on for long periods in production.
The Trace Window
While tracing is on, a Trace Window item will appear at the bottom of the menu. Click it to open the Tracing window. You can move and resize it while you work in the rest of the Gateway.
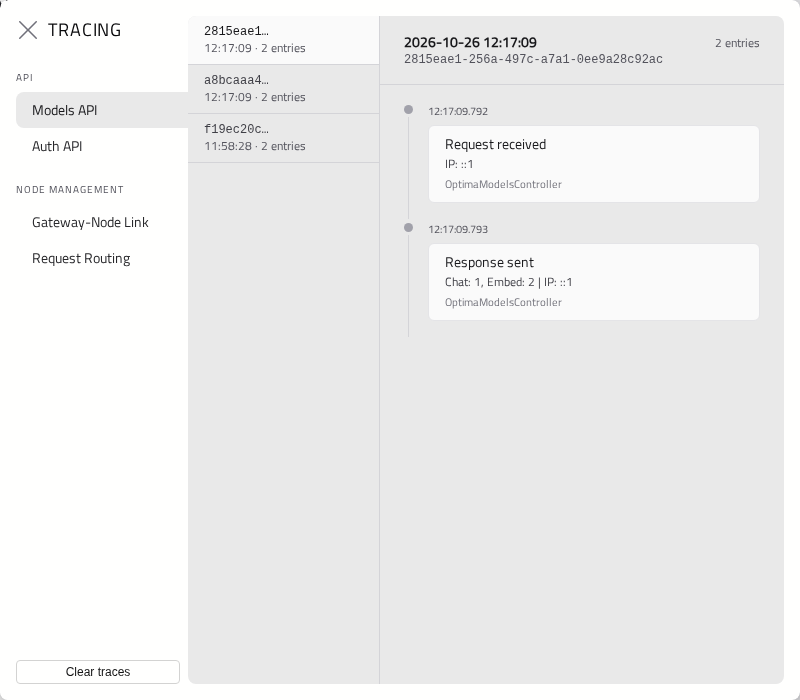
The window has three columns:
Channels (left) — named areas of the Gateway, grouped by category, such as the chat completions API, embeddings, conversations, models, sign-in, and starting and stopping Executors. A channel only appears once it has recorded something.
Instances (middle) — each request or operation in the selected channel. Select one to see its entries.
Trace entries (right) — the individual steps of the selected instance, with any detail attached.
Click Clear traces to remove everything recorded so far.
Log Files
Each component writes a log file for each month into a Logs folder in its data folder. The quickest way to open one is Open logs in the installer's Manage page. See Logs And Data.
| Component | Windows | Linux | macOS |
|---|---|---|---|
| Gateway | C:\ProgramData\Parker Software\OnVerisGateway\Logs |
/var/lib/ParkerSoftware/OnVerisGateway/Logs |
/Library/Application Support/Parker Software/OnVerisGateway/Logs |
| Node | C:\ProgramData\Parker Software\OnVerisNode\Logs |
/var/lib/ParkerSoftware/OnVerisNode/Logs |
/Library/Application Support/Parker Software/OnVerisNode/Logs |
| Installer | C:\ProgramData\Parker Software\OptimaInstaller\Logs |
/var/lib/ParkerSoftware/OptimaInstaller/Logs |
/Library/Application Support/Parker Software/OptimaInstaller/Logs, and ~/Library/Logs/OptimaInstaller for the installer window itself |
Note
On a machine first installed as Optima, the Gateway and Node folders say OptimaGateway and OptimaNode, and so do the service names below. See Machines First Installed As Optima.
Note
Older Node versions wrote their log file elsewhere: to C:\Windows\System32 on Windows, and to the Node's installation folder, /opt/OptimaNode, on Linux and macOS. Open logs and the support zip look there too.
The operating system also records when a service starts, stops or fails, which helps when a service stops before it can write anything itself:
- Windows — the System log in Event Viewer, from Service Control Manager.
- Linux —
sudo journalctl -u OnVerisGatewayorsudo journalctl -u OnVerisNode. - macOS —
/var/log/com.parkersoftware.onverisgateway.logand.err.log, and the same foronverisnode.
Collecting Logs For Support
If Parker Software support asks for your logs, the installer can collect all of the above into one zip file, without any settings files or access keys. See Collecting Logs For Support.
Licence And Connection Problems
Some problems are reported elsewhere in the Gateway:
- Problems with the licence will show as a banner across the top of every page. See Licensing.
- A Node that cannot be reached shows why, and when it will try again, on the Nodes page. See Managing Nodes.
- The Reliability tab of the Analytics page shows failed and interrupted requests over time. See Analytics.